Which places could decide 2028?

A comparison of places under a stated assumption, not a forecast: which states and counties could decide the presidential election, and how often.

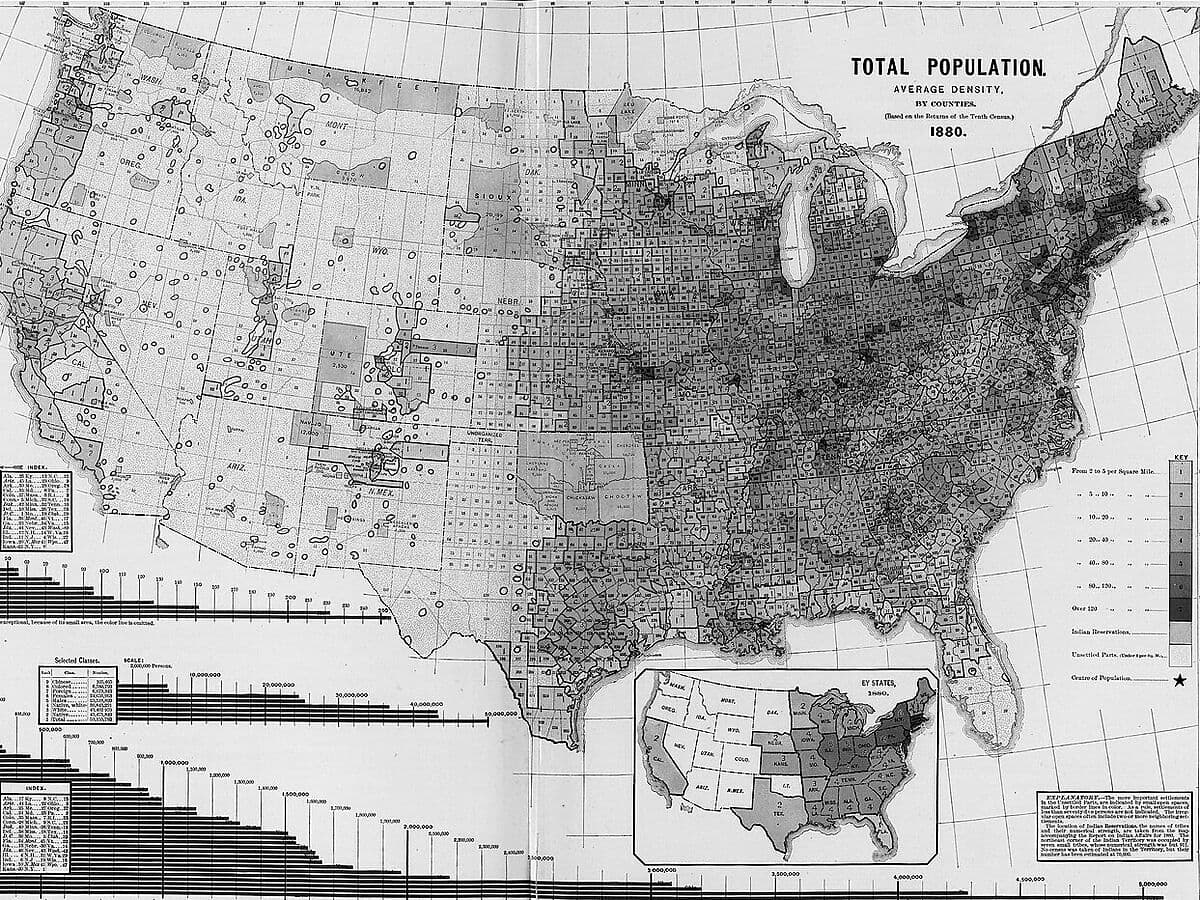
Greyscale map of the United States by county, titled Total Population, Average Density, 1880, darkest in the Northeast and Midwest and pale across the West.
History, not this site's data. Total population, average density by counties, 1880. From Scribner's Statistical Atlas of the United States (1883). David Rumsey Map Collection, via Wikimedia Commons. Picture credits
Zoom to state

Pennsylvania has 3.5% of electoral votes but decides 32.6% of simulated elections.

How often this state decides the election in our simulations
Under 1%
  1. 1%
  2. 3%
  3. 10%
  4. 30%
Circles: the chance a county’s own result decides the election, from 0.20% to 1.17%.

A comparison of places under a stated assumption, not a forecast. Shading shows how often a state decides the election in our simulations, not who wins it. A single county’s chance cannot be tested against past elections: none was decisive in any of them.

Seven states, nearly all of it

Seven states (PA, MI, GA, NC, WI, NV, AZ) hold about 97% of tipping-point probability, and Pennsylvania has 3.5% of electoral votes but about a third of the tipping-point probability.

97.0%

The seven rows, each rounded to one decimal, add up to this. Method, tests and limits →

Share of simulated elections each state decides

The seven states

  • Pennsylvania · 19 electoral votes32.6%
  • Michigan · 15 electoral votes16.7%
  • Georgia · 16 electoral votes16.2%
  • North Carolina · 16 electoral votes14.3%
  • Wisconsin · 10 electoral votes10.7%
  • Nevada · 6 electoral votes3.6%
  • Arizona · 11 electoral votes2.9%
  • Total97.0%

Counties in focus

In order of how often a county’s own result decides the election across 400,000 simulated elections. All counties in focus →

Tested on past elections

We tested the simulation on past presidential elections. Its 80% intervals covered fewer results than 80% in 2016 and more in 2020 and 2024.

We backtested the simulation on 9,312 county results and 153 state results from the 2016, 2020 and 2024 elections (earlier elections lack the history to test); its 80% county-margin intervals covered 60% of results in 2016 and 97⁠–⁠98% in 2020 and 2024.

county results
9,312
Each county’s margin, in each tested election.
state results
153
Each state’s result, in each tested election.
elections
2016, 2020, 2024
Earlier elections lack the history to test.
inside the 80% intervals
60⁠–⁠98%
60% of results in 2016 and 97⁠–⁠98% in 2020 and 2024.
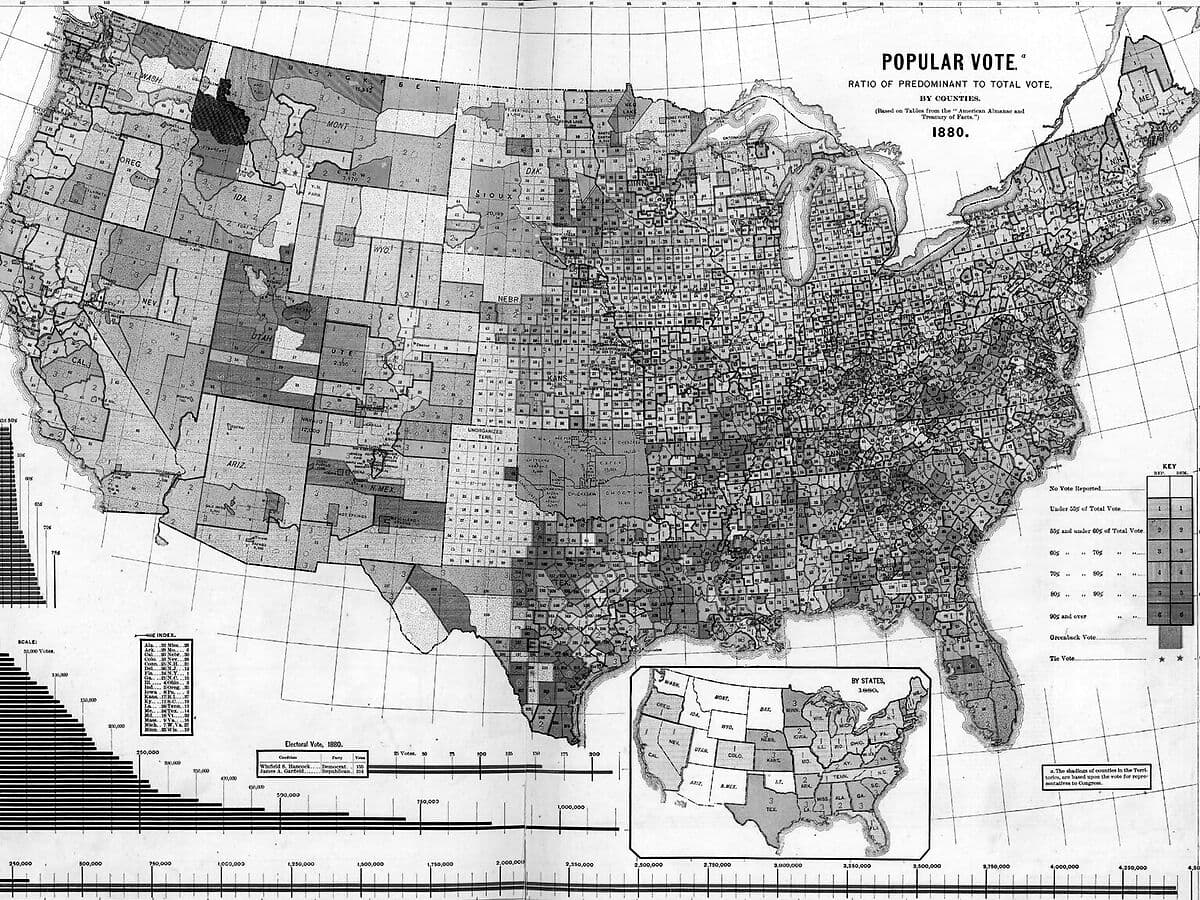
Greyscale map of the United States by county, titled Popular Vote, 1880, with the Great Lakes, a state inset and a bar chart in the lower corners.
History, not this site’s data. Popular vote by counties, 1880. From Scribner's Statistical Atlas of the United States (1883). Via Wikimedia Commons.

Tide and Terrain

The tide is statewide electoral change. The paper calls shared electoral movement the “tide.” Here, the benchmark is the change in a state’s Democratic two-party vote share.

The terrain is county movement relative to its state. Subtract statewide change from county change to find the county’s relative swing; its absolute value measures the size of that difference.

Which counties move differently from their state?

We compare county and statewide electoral swings, then ask how much local economic change helps explain the difference.

County characteristics and voting history explain more than measured local economic change.

Reported in the brief, not yet reproduced here →

Vote-by-mail ballots being counted at the Santa Clara County Registrar of Voters, 7 November 2018. Legoktm, CC BY-SA 4.0, via Wikimedia Commons. Picture credits

Loading historical county departures…

Preparing the matched counties and their statewide benchmarks.

What the research brief reports

The research brief and the white paper report these findings. The paper’s exact supporting tables have not been independently reproduced; these are not independently verified website results.

County characteristics and voting history explain more than local economic change.

The research brief reports that county composition and voting history explain about half the variation in departures. Measured economic and population changes add little.

About half

Status. Reported explanatory power · awaiting source verification.

The white paper describes the sample, election coverage and model, but its tables have not been independently reproduced here. Explanatory power is not vote share; no precise incremental percentage is plotted.

Read the evidence status →
Economic deterioration did not consistently lead to losses for the incumbent party.

The brief reports slightly pro-incumbent movement, about a quarter of a point relative to the state, among the bottom 5% for relative employment growth. It describes ten tests without a consistent relationship.

≈ 0.25 pp

Status. Toward the incumbent, relative to the state · reported subgroup average, unverified.

The subgroup, employment definition, weighting and ten-test ledger remain unverified. This does not mean hardship benefits incumbents or disprove economic voting nationally.

Read the evidence status →

Volatility is associated with characteristics of places.

The brief identifies smaller electorates, lower educational attainment, transfer-income reliance, previous large swings, population below past peaks, and rapid population growth or decline.

Reported place characteristics

Status. Reported associations · awaiting source verification.

These are reported associations, not individual voter motives or causal effects. Their exact estimates and publication status remain unverified.

Explore historical departures →

Compare employment, population, migration and housing data. Check the dates before relating these figures to an election.

  • Jobs & unemploymentMonthly since 2015

    The county unemployment rate every month since 2015, on one map with a slider.

  • Population & migration

    Net migration for every county, from IRS and Census data.

  • Housing & costs

    Home values, new-housing permits and household costs, each at the geography its source publishes.

  • Data centers

    Where data centers are mapped, and how fast electricity demand is growing around them.

  • Election results2024 certified

    The certified 2024 presidential result and every House and Senate seat on the 2026 ballot.

  • Electoral leverage

    The counties a simulated presidential election turns on, with their economy side by side.

  • RedistrictingSince 1976

    How district maps turn House votes into House seats, election by election since 1976.

  • All existing measures

    Voting, employment, population, migration and housing measures, each with its own period and source.

Unemployment rates run through August 2026, as of October 8, 2026.
Each page lists its sources and dates.

The sources behind every figure

Greyscale crop of a printed table of Pennsylvania counties with date of formation and acres, beside the heading of a Population of Pennsylvania table.
Names of counties, date of formation and acres, with the start of the Population of Pennsylvania table. From Caldwell's Atlas of Clarion County, Pennsylvania (1877). David Rumsey Map Collection, via Wikimedia Commons. Picture credits

U.S. Census BureauBureau of Labor StatisticsInternal Revenue ServiceFederal Election CommissionMIT Election Data + Science LabClerk of the U.S. HouseALARM ProjectOpenStreetMap contributorsEnergy Information AdministrationCatalyst Cooperative’s PUDLZillow

Each historical comparison includes its period, statewide benchmark and sources. The map covers counties with matched, released returns. The white paper reports the brief’s three findings; the tables behind them have not yet been independently reproduced.

Ask about a county

Analytics and political communication strategy, grounded in the local evidence.

Write to us

Opens your email program with these details. Nothing is sent from this page.