Research scope and publication standards
Providence Strategy examines how economic, demographic and political conditions differ across places. The purpose is to make change easier to investigate, compare and understand.
Explore the analysis
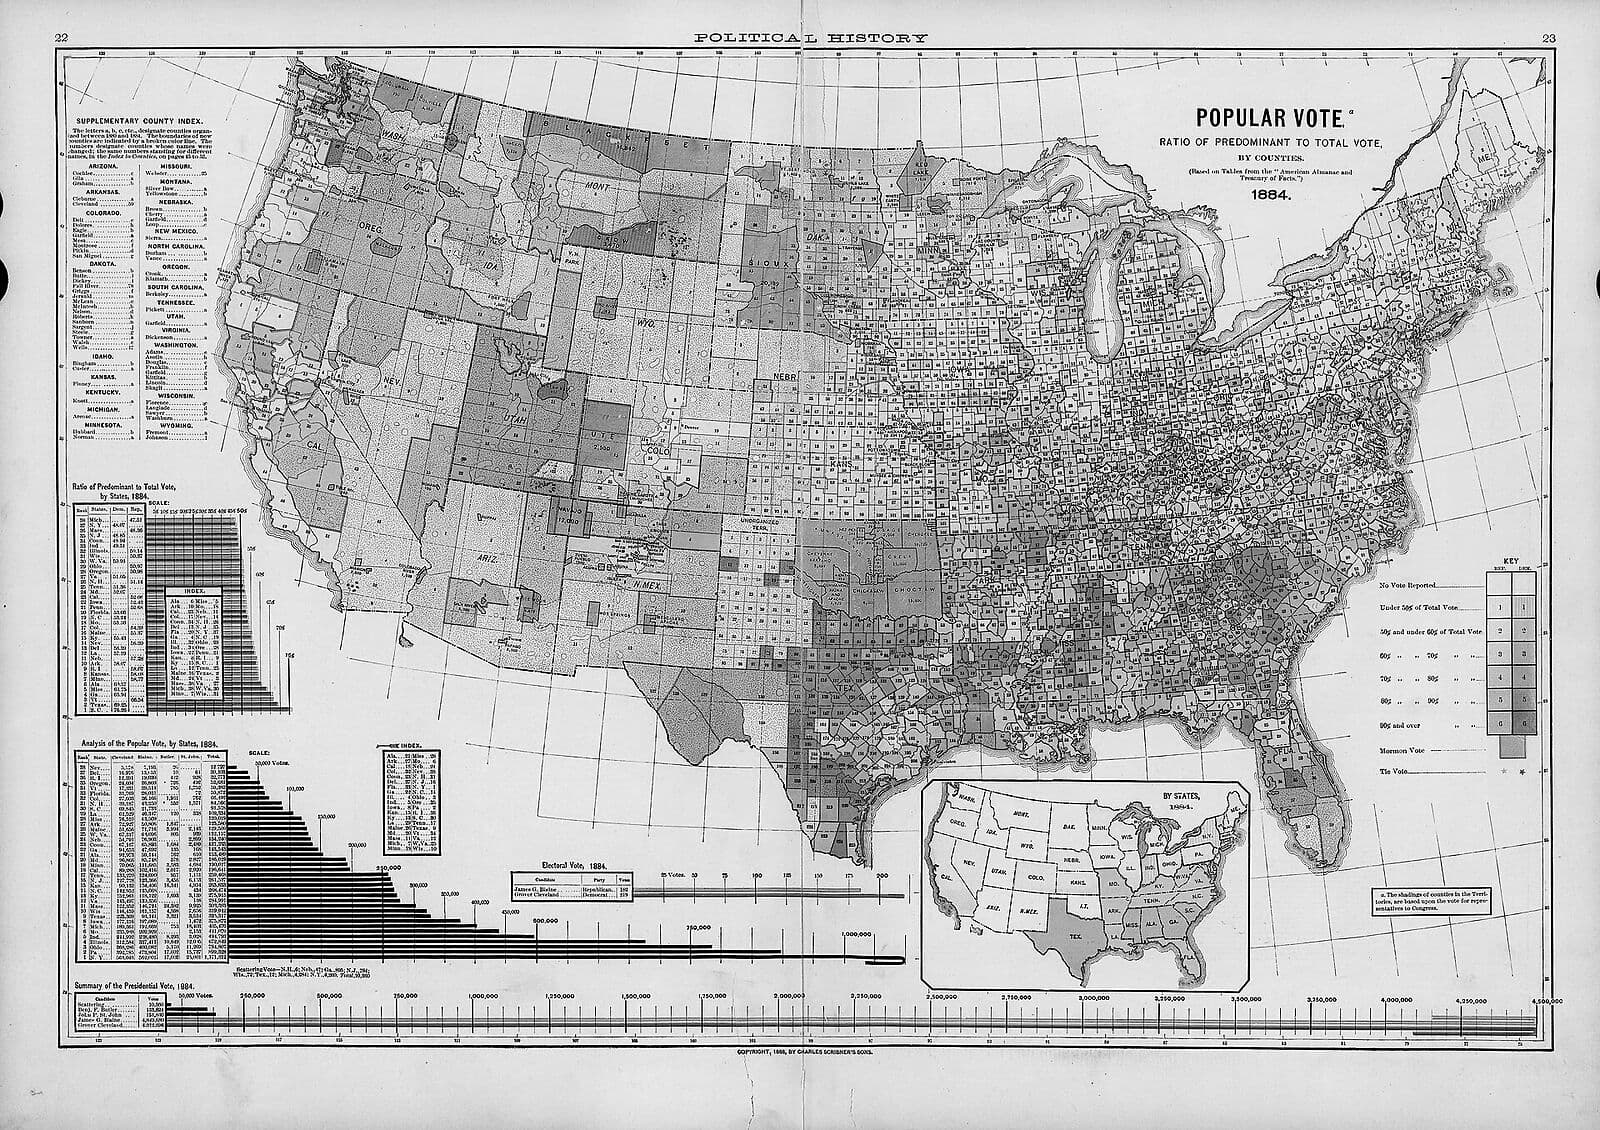
Start with a place: the map covers 3,112 audited counties across five perspectives, and every county has its own profile. Beyond the map are the 2026 federal ballot seat by seat, the Counties in focus simulation, the migration corridor deep dive and cost & building trends. Detailed methods are in the methodology, and the white paper states the program’s question and limits.
Every source is cited
Every figure we publish names its source, with the period and the places it covers, and a label saying what kind of organization published it. Many come directly from government statistics and certified election results; others come from research datasets published by universities, newsrooms and other organizations, and some from private companies that publish figures from their own platforms, such as job postings.
Some questions need our own research: data we compile from many separate documents, models and simulations we build, and corrections we make where sources disagree. That work is labeled as our own, its method is published, and every source it draws on is cited, so any figure can be traced back to where it came from.
Before we show a figure we read its publisher's method and terms; where the terms do not allow republishing, we link to the source instead. Figures from different publishers are never blended into one number, and figures from private companies are context only: they never enter a score of ours.
The sources behind the analysis
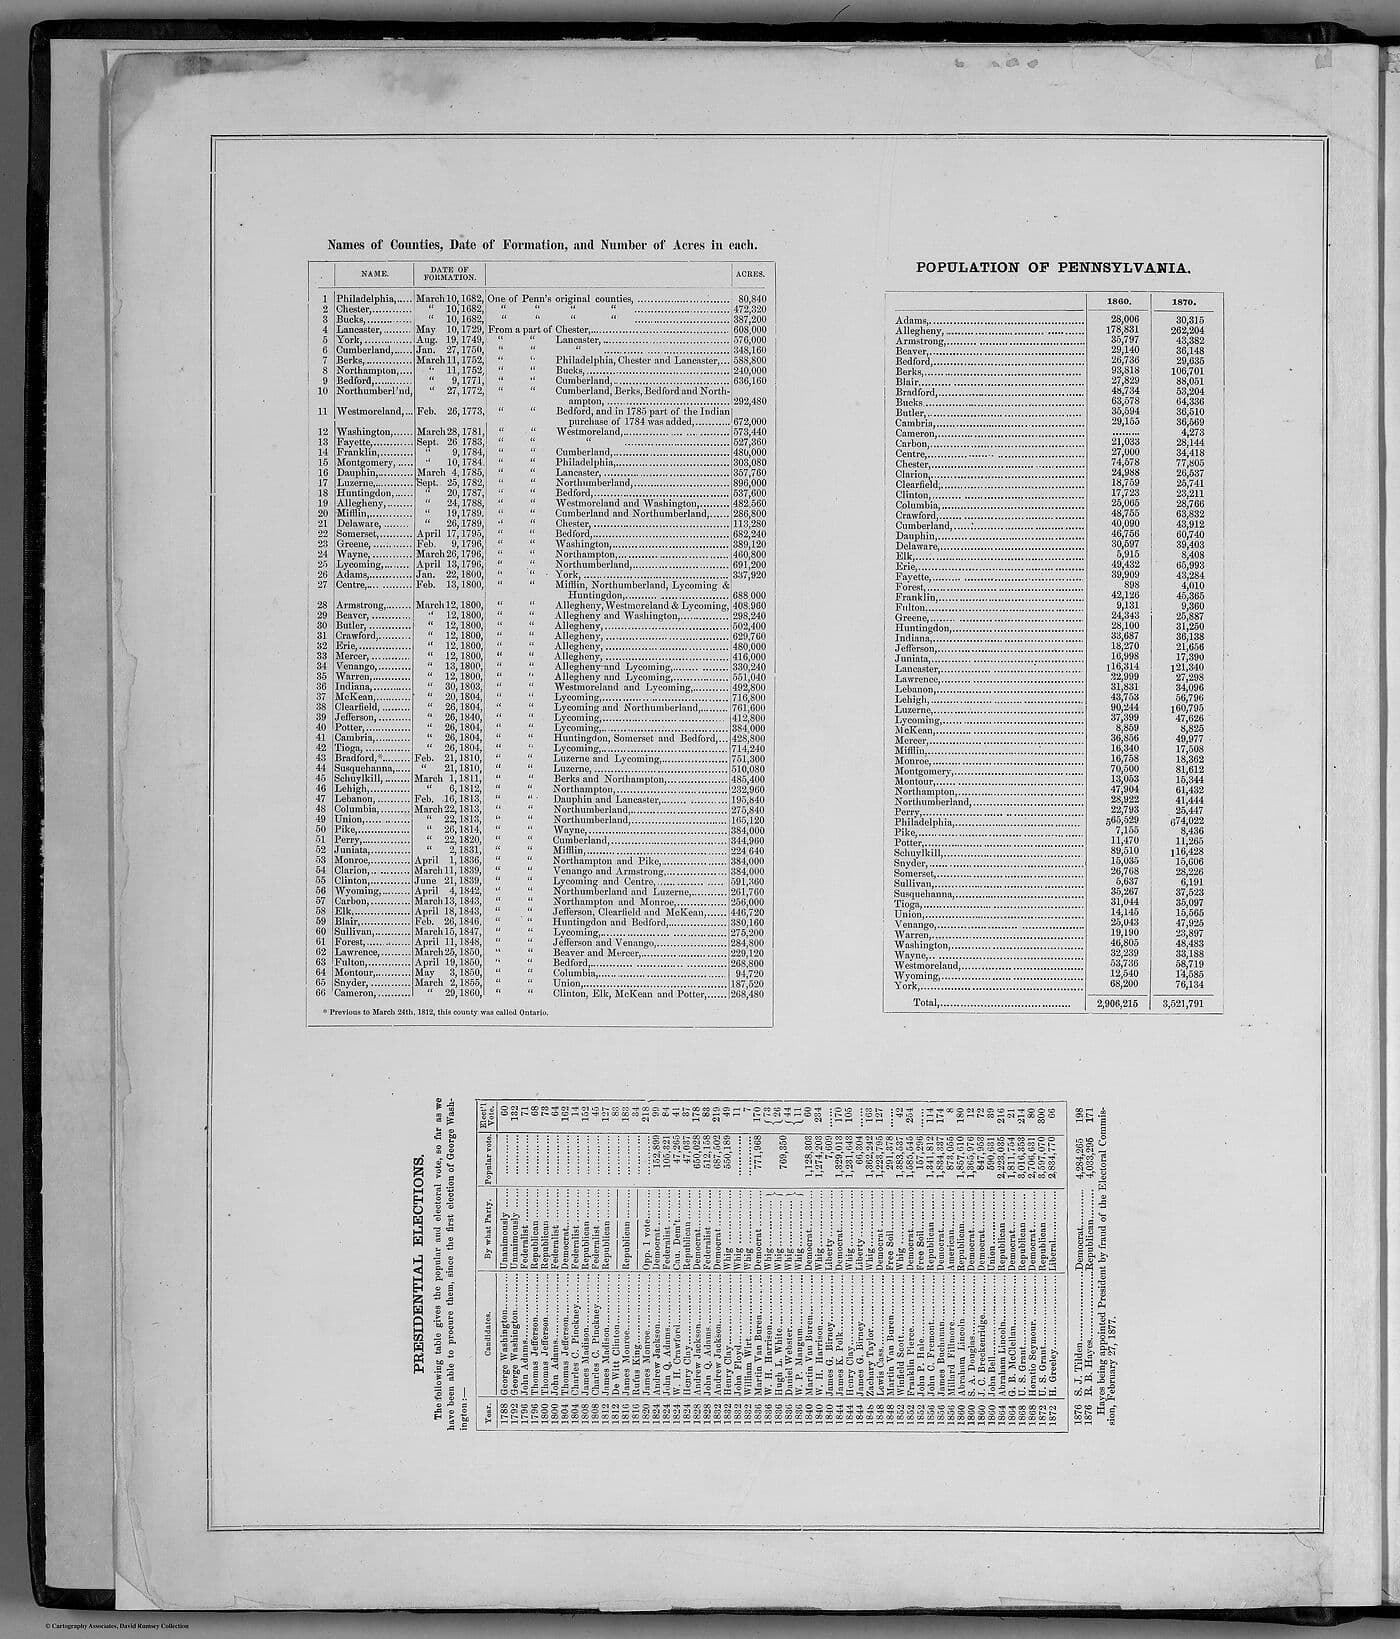
The analysis draws on official election results; the 2024 presidential results as reported; the Census Bureau’s American Community Survey — 2020–2024 five-year estimates of income, poverty, education, homeownership and rent burden for 3,104 counties, and the 2015–2019 estimates that were inputs to the 2020 research model; BLS Local Area Unemployment Statistics for 3,104 of 3,112 counties each month since 2015; IRS county migration totals and Census Bureau population estimates for every county, and the county-to-county corridors IRS publishes, covering 6,470,553 tax returns in 2022→2023 (99.82% of comparable published returns); and, for costs, published price series used as clearly labeled research previews. Each measure identifies its source, period and geographic coverage.
What we publish about elections
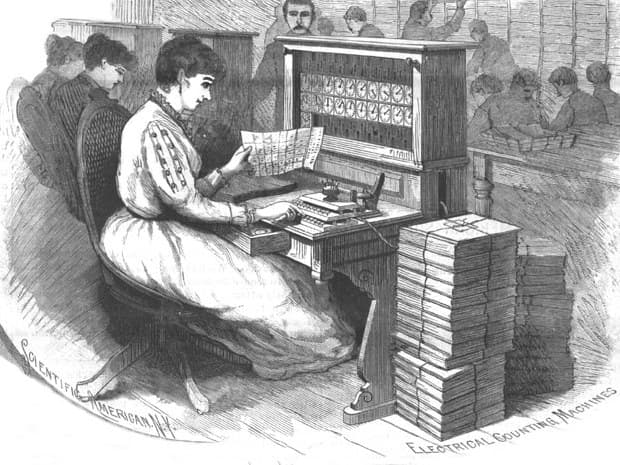
We publish certified election results and documented facts about the 2026 ballot. On two pages, the home page and Counties in focus, we also publish probabilities from a simulation: it is how Counties in focus picks its counties, and the home page shows the same results by state. The simulation starts from the 2024 county results and adds swings whose sizes are estimated from past presidential elections: a national swing, shared swings for regions, states and groups of similar counties, and variation in each county. It uses no polls, candidate information or economic forecasts. For each county it asks one question: across the simulated elections, how often would a different result in this county alone change the Electoral College winner?
These numbers exist to compare places with each other. They are not a forecast of the next presidential election, a measure of how much one person’s vote counts, or a guide to where campaign spending pays off. They change when the assumptions change, and Counties in focus shows by how much. We publish no sentiment scores and no live monitoring feeds.
What we do not claim
No durable economic or migration forecasting signal has been established; the full historical model results remain available in the methodology. Nothing we publish is a prediction of any election.
We also do not present modeled scores as facts, fill gaps with estimates, attribute beliefs to movers, or treat a metro price index as a county price. Where a number is missing, suppressed, or out of coverage, it is labeled that way.
Who is responsible
- Publisher and maintainer
- Providence Strategy publishes and maintains this website.
- Review
- Every release passes automated verification checks and human review before it is published. Data that has not completed those checks is labeled as a preview.
- Corrections
- When we find or are told about an error, we correct it and record the change in the public corrections log, with the date and the data affected.
- Contact
- Email: hello@providencestrategy.com.
Publication status
This is a working research publication. Published data is labeled as published; research previews are labeled separately. The evidence standard, validation results, and known limits are documented in the methodology, and the state of the research program is set out in the white paper.